Instructional Sequences Thought to Scaffold Students' Exploration of Data
When professionally collected datasets and early online data viewers first became available, pioneering educators found ways to engage their students in working with these data. The early lessons tended to follow a common pedagogical style: the student was directed to go to a certain URL, select a specified set of options, view the resulting data visualization, answer a set of questions, and then repeat with a different visualization. This format gives students practice at accessing a database and interpreting data, but it does not move them very far towards being able to use professionally collected data in circumstances where no cookbook is available. At the other extreme, simply putting students in front of a data visualization tool, giving them access to the riches of the world’s data and inviting them to look around, leaves most students floundering. The challenge is to find an instructional sweet spot that give students enough scaffolding and structure that they can learn from the provided data, a sweet spot in between floundering and cookbook.
A notable early success in having students learn from professionally collected data was Discovering Plate Boundaries, which used a form of jigsaw instructional sequence. Students first worked in homogeneous small groups where they became expert in a single data type (earthquakes, volcanoes, seafloor age, topography/bathymetry) while working with a global map (on paper) of that data type. They then recombined into heterogeneous groups, with one expert on each data type in the group, and combined their expertise to collaboratively interpret one tectonic plate. The lesson for ODI from the success of “Discovering Plate Boundaries” is not that all datasets should be explored via a jigsaw approach, but rather that there are instructional sequences or strategies that give students sufficient scaffolding that they can learn from the data and each other.
We are compiling and documenting a suite of such instructional sequences that are currently in classroom use and that are potentially generalizable to multiple instructional contexts.
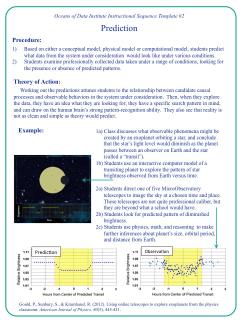
- In Prediction, students predict how the data would look under various conditions and then compare the data with their predictions. (Click to images to enlarge.)
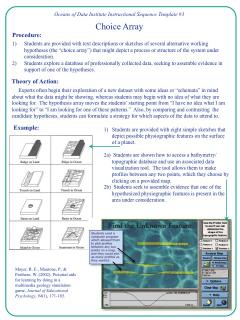
- In Choice array, students are given a set of alternative working hypotheses and have to determine which one to support by exploring the data.
- In Backwards faded scaffolding, students do a series of short data activities on the same dataset, taking responsibility for more and more of the inquiry on each repetition (Slater, 2013).
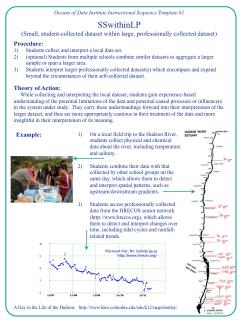
- In SSwithinLP, students first collect and interpret a small student-collected (SS) dataset in their classroom or locality, then interpret a larger, professionally collected (LP) dataset that encompasses and extends the circumstances covered by the SS dataset.
- In High insight-to-effort ratio snippet, the instructional designer pre-selects snippets in which an important phenomenon of the referent system is particularly conspicuous, and designs a series of questions to lead students towards an Aha! moment of recognition of the connection between process and product. This is the instructional sequence used in the Data Puzzle project.


