Develop and Test
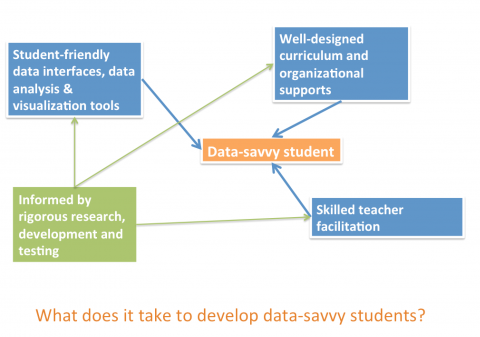
To meet the potential for Big Data to transform the classroom, the Oceans of Data Institute is developing and testing critical supports for students and teachers, including:
- appropriately designed curricula and organizational supports
- student-friendly data access portals and data analysis tools.
- professional development for teachers to hone their skills in using Big Data
Developing curricula to build students’ skills in working with complex data
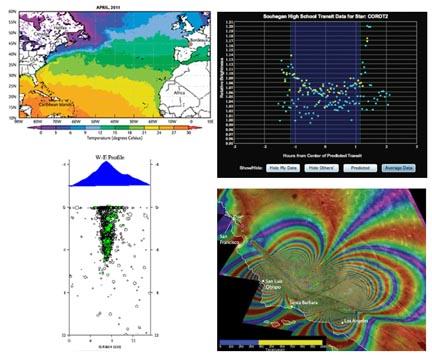
Today’s science texts, by and large, do not attend to the broad array of skills necessary to bring students to data-using proficiency, from working with student-collected data sets and considering aspects of experimental design to looking for patterns in professionally collected data sets. Curriculum supports are also necessary to help students understand the broad variety of ways that data are visualized—for example, as maps showing sea surface temperature, scatter plots of light levels used to detect exoplanets around distant stars, cross-sectional displays of earthquakes detected below a volcano, or animated displays of ground deformation during earthquakes (see figure below). And well-designed curriculum scaffolding is essential to help students develop their own ideas about what data show and support these ideas with quantitative evidence.
By engaging in a rigorous process of developing, testing, redesigning, and retesting curricula, the Institute is building a body of resources to support students as they prepare to participate in a data-rich workforce and world. We are developing prototypes and testing their effectiveness at moving novices toward data proficiency; translating these into instructional materials, assessment tools, and curriculum guides; and integrating these curriculum tools with professional development resources and carefully designed tools by which students represent and visualize data.
View examples of our curriculum work
Developing interfaces and software tools that facilitate students’ work with data
Professional databases and data visualization tools are industrial strength—designed by experts for use by experts—which significantly impedes broad use by novice learners. Database interfaces developed for expert scientists may be unintelligible to novices who are unfamiliar with scientific vocabulary and technology tools. Furthermore, education researchers have identified cognitive barriers that affect students’ ability to read maps and other data visualizations, recognize trends in graphed data, and reason with scientific evidence.
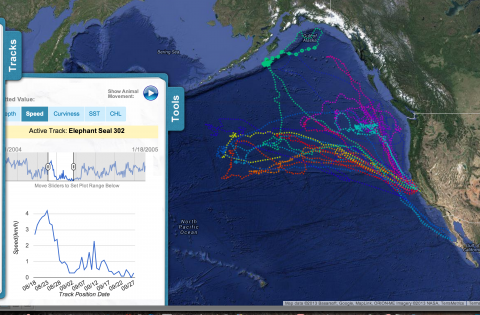
Student-friendly data interfaces and data analysis tools are powerful components of learning environments that build data proficiency. Visualizing Oceans of Data: Educational Interface Design compiles knowledge and presents guidelines about how to design student interfaces to scientific data that:
- get students quickly to the data
- allow them to easily create and interact with data displays
- automate processes not important to the learning goals
- minimize distracting information and make what’s important stand out
- support students in conducting the same analyses experts do
View examples of our work developing and testing interfaces and data analysis tools
Developing models of teacher support
Successfully engaging students with large, complex data sets requires considerable skill on the part of the teacher. This means teachers need support in many forms, from face-to-face professional development programs that provide opportunities for teachers to practice and develop their own data-using skills, to guides that provide practical day-to-day support to teachers as they facilitate students’ work with data in the classroom.
The Oceans of Data Institute is working closely with teachers to develop a range of professional development programs, including:
- embedding educative materials for teachers within curriculum materials
- providing face-to-face workshops
- providing online materials
- identifying and documenting reusable, generalizable instructional sequences


